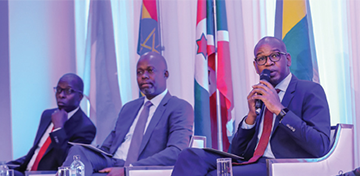
Growth driven by increased transactional activity and higher loan volumes
KCB Group PLC after tax profit grew 11% to KShs. 5.8 billion in the first quarter of 2019.
Stronger non-funded income lines, robust loan book growth and reduction in interest expense drove performance from KShs. 5.2 billion reported the same period last year.
KCB Group CEO and MD Joshua Oigara said while the regulatory and operating business environment remained in flux, the Group’s corporate and retail franchises continued to post impressive returns, helping the lender to grow its market share.
“The performance is as a result of a sustained strategy that is anchored on a simplified customer journey and products that provide solutions to our customers” said Mr. Oigara during the release of the financial performance in Nairobi.
Further to the upgrade on our digital banking platform in 2018, channel performance has significantly improved with 91% of total transactions performed outside the branch. This comprised of 56% on mobile, 27% on agency, internet and POS and 8% on the ATM.
In line with the strategic shift and investment in our digital channels, non-branch revenue grew 137% to KShs. 3.2 billion driven by disbursement of mobile loans, which grew 270% from KShs. 9.2 billion in March 2018 to KShs. 33.8 billion in March 2019.
Financials
Interest income growth of 7% coupled with a 4% reduction in interest expense, 12% increase in fees and commissions drove total income up by 11% to KShs. 18.8 billion.
On the balance sheet side, total assets increased by 12% funded by 11% growth in deposits and the resultant loan growth of 11%.
This saw the Group’s balance sheet surge to KShs. 725.7 billion while deposits hit KShs. 552 billion from Kshs. 496 billion.
KCB Group capital base remained well within both internal and regulatory limits. Core capital as a proportion of its total risk weighted assets closed the period at 18.6% against the Central Bank of Kenya statutory minimum of 10.5%. Total capital to risk-weighted assets stood at 20.0% against a regulatory minimum of 14.5%.
Key Highlights
|
|
Matrix
|
Q1 2018
|
Q1 2019
|
YoY Change
|
|
Profitability
|
Net Profit
|
KShs.5.2B
|
KShs.5.8B
|
11%
|
|
Total interest expenses
|
KShs. 4.2B
|
KShs. 4.1B
|
-4%
|
|
Return on Average Equity
|
19.5%
|
21.9%
|
+240bps
|
|
Operational Efficiency
|
Operating Expenses (excl. provisions)
|
KShs.8.9B
|
KShs.9.1B
|
2%
|
|
Cost to Income Ratio (excl. provisions)
|
49.1%
|
48.5%
|
-60bps
|
|
Cost of Funds
|
3.2%
|
2.8%
|
-40bps
|
|
Balance Sheet Position
|
Total Assets
|
KShs.647.5B
|
KShs.725.7B
|
12%
|
|
NPL Coverage (IFRS 9)
|
61.0%
|
60.8%
|
-20bps
|
|
Total capital to risk-weighted assets (CBK min 14.5%)
|
15.3%
|
20.0%
|
+470bps
|
|
Core capital to total risk weighted assets (CBK min 10.5%)
|
15.1%
|
18.6%
|
+350bps
|
|
Shareholders’ equity
|
KShs. 99.6B
|
KShs.119.4B
|
20%
|
Mergers and Acquisitions
KCB Group is keen on new growth opportunities through M&A and is in the process of transferring part of the assets and liabilities of Imperial Bank In Receivership Limited. The Group has also made a takeover bid for National Bank of Kenya. Both transactions are targeted for completion in the third quarter of 2019.
The two transactions, said the Group CEO, are within the Group’s expansion strategy and gives KCB a stronger edge to play a bigger role in driving the financial inclusion agenda in the East African region while building a robust and financially sustainable organisation.
Outlook
“We expect some inflationary headwinds in the economy as a result of lower rainfall in Kenya and increasing fuel prices. The Group has capacity to navigate through this and are therefore optimistic we will maintain our positive growth trajectory,” said Mr Oigara.


